UFO Sightings
Data Visualization
Mapping The Most Unimaginable Quantitative Data - UFO Sighting Data
One data visualization presents a dataset that shows how people see and interpret the unexplained phenomenon of daily life, which UFO and aliens could be the symbolic representatives that illustrate the idea.
Developing Tool: CartoDB, Open Refine

The Developed Interactive UFO Sighting Map

Interaction Description
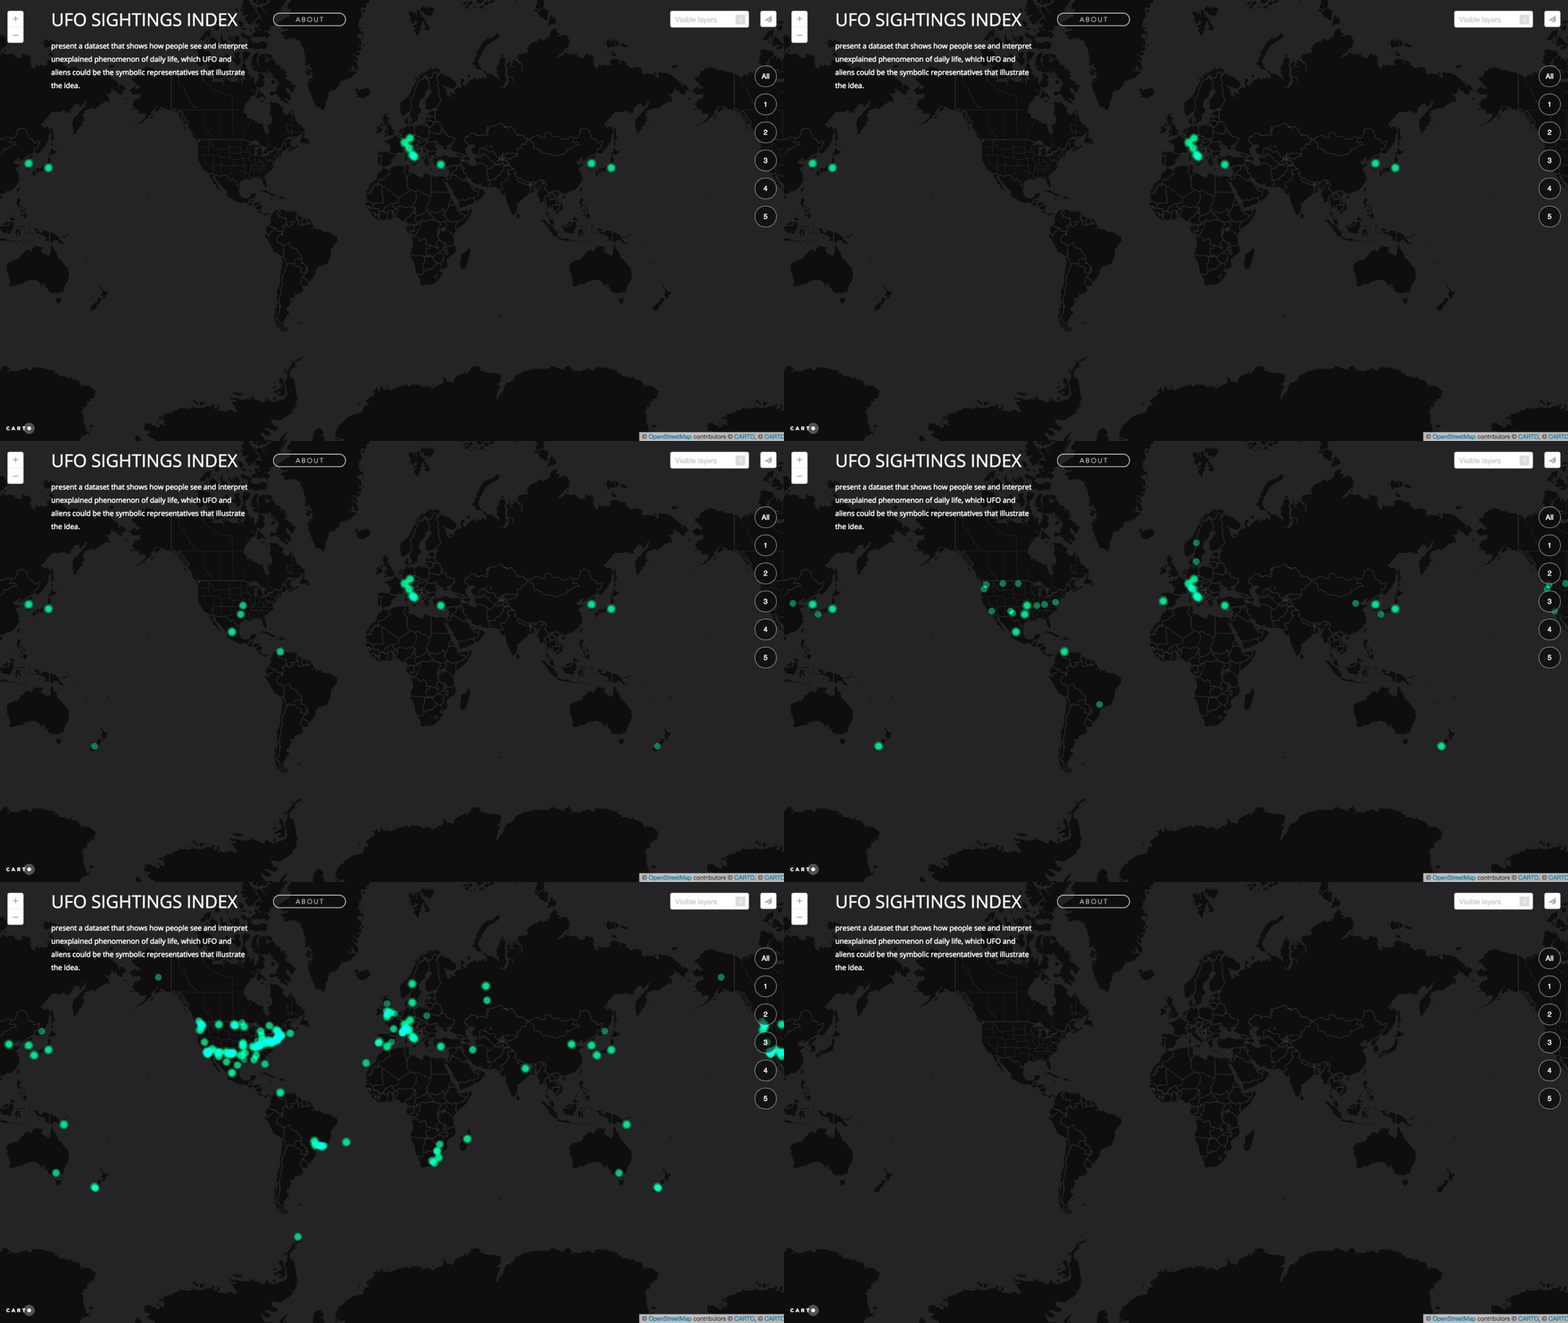
Under the mode of time lapse, viewers can see the entire features UFO sighting has been exponentially increasing as time goes by. Besides, users can simply see the change of the amount of in UFO sightings by dragging a timeline bar in this interactive map.
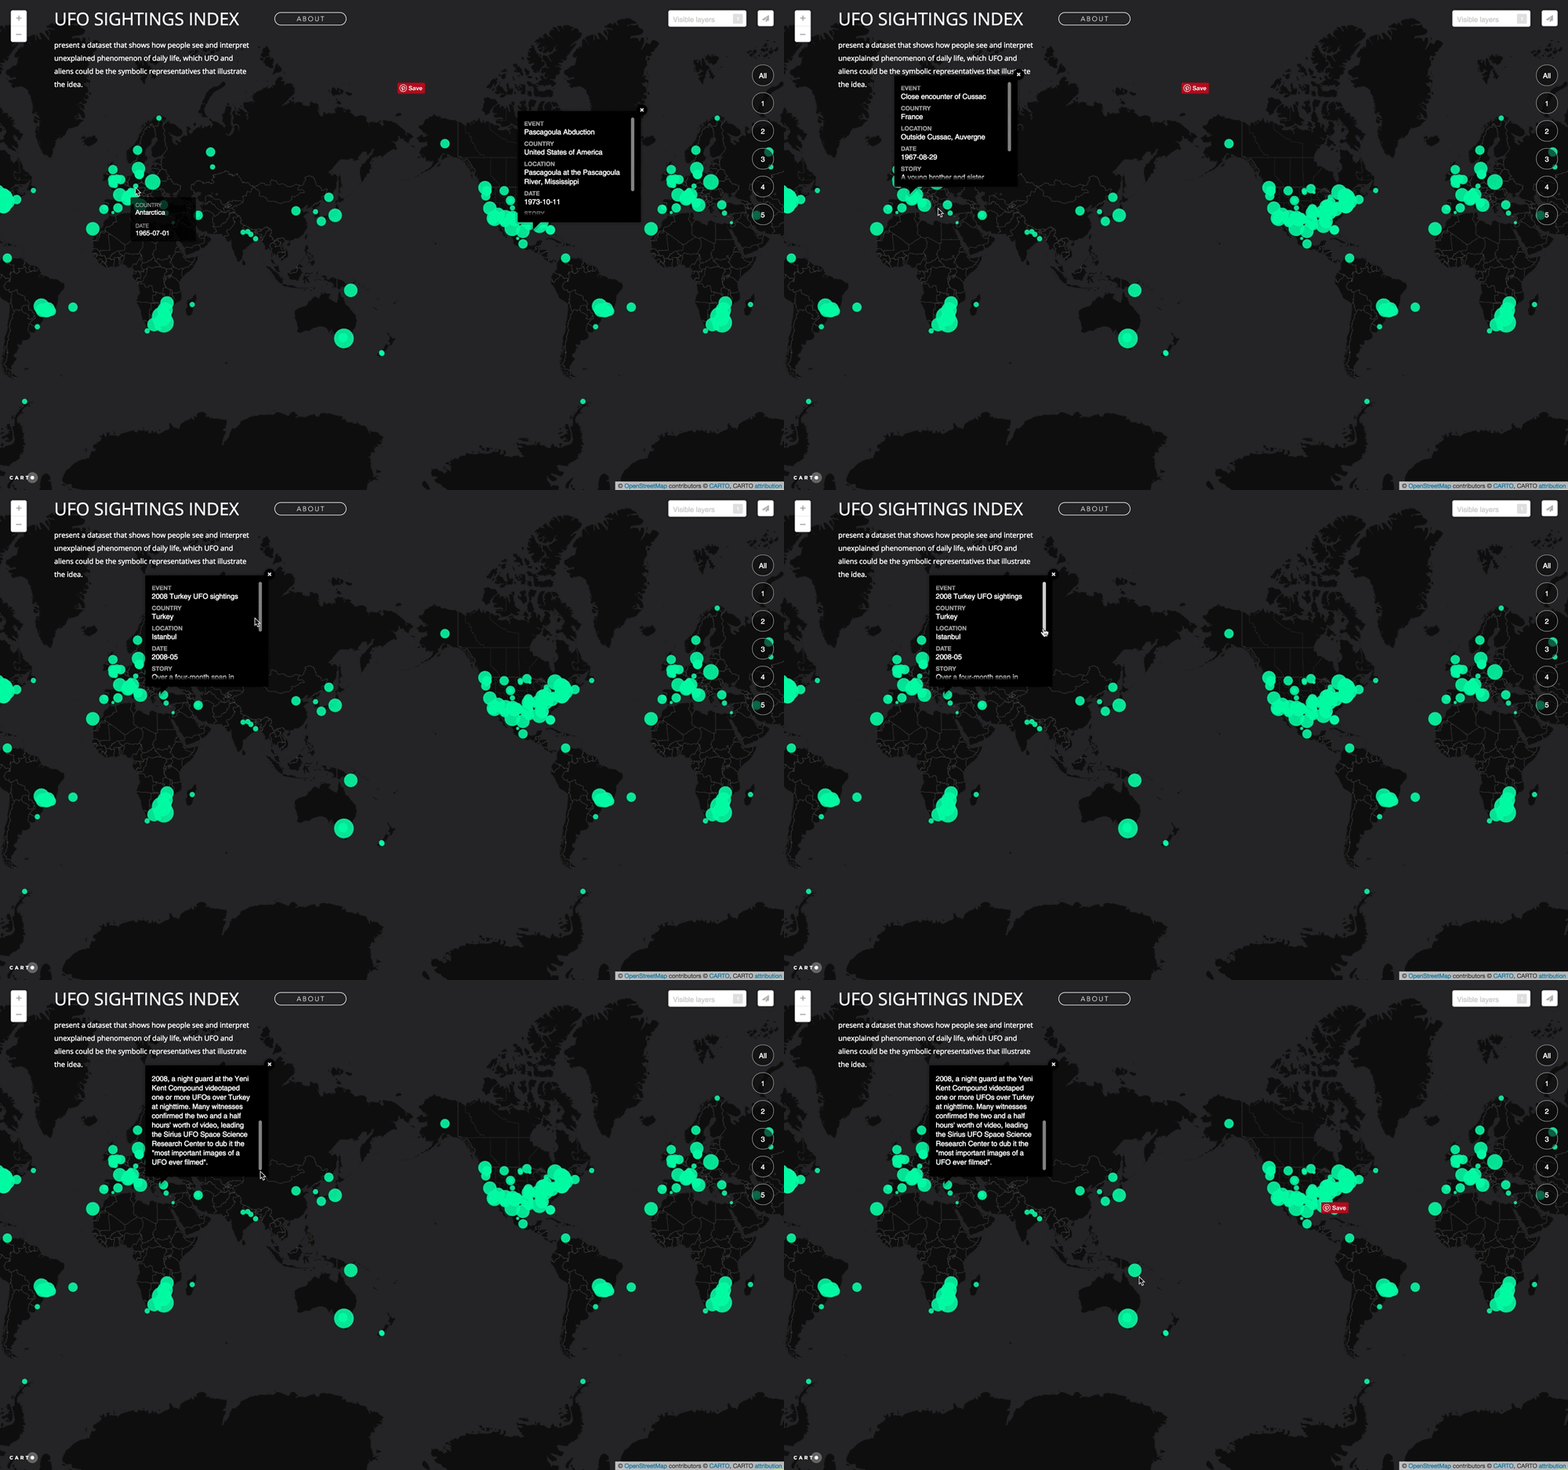
On the events mode, the final map shows bubble charts on the world map which represents the numbers of UFO sighting by each location. Viewers can explore each UFO event by hovering on it and look up the details of the UFO seeing, like the seeing date, specific location and the brief.
Event mode to explore the UFO seeing event
Time lapse mode to explore the UFO seeing event


Inspiration
People see different kinds of UFOs from time and regions, and people may have different ways to describe how the UFOs look like, scale, speed, and how they appear and move. We want to present a data set that shows how people see and interpret the unexplained phenomenon of daily life, and UFO and aliens could be the symbolic representatives that illustrate the idea.
Audience

Data
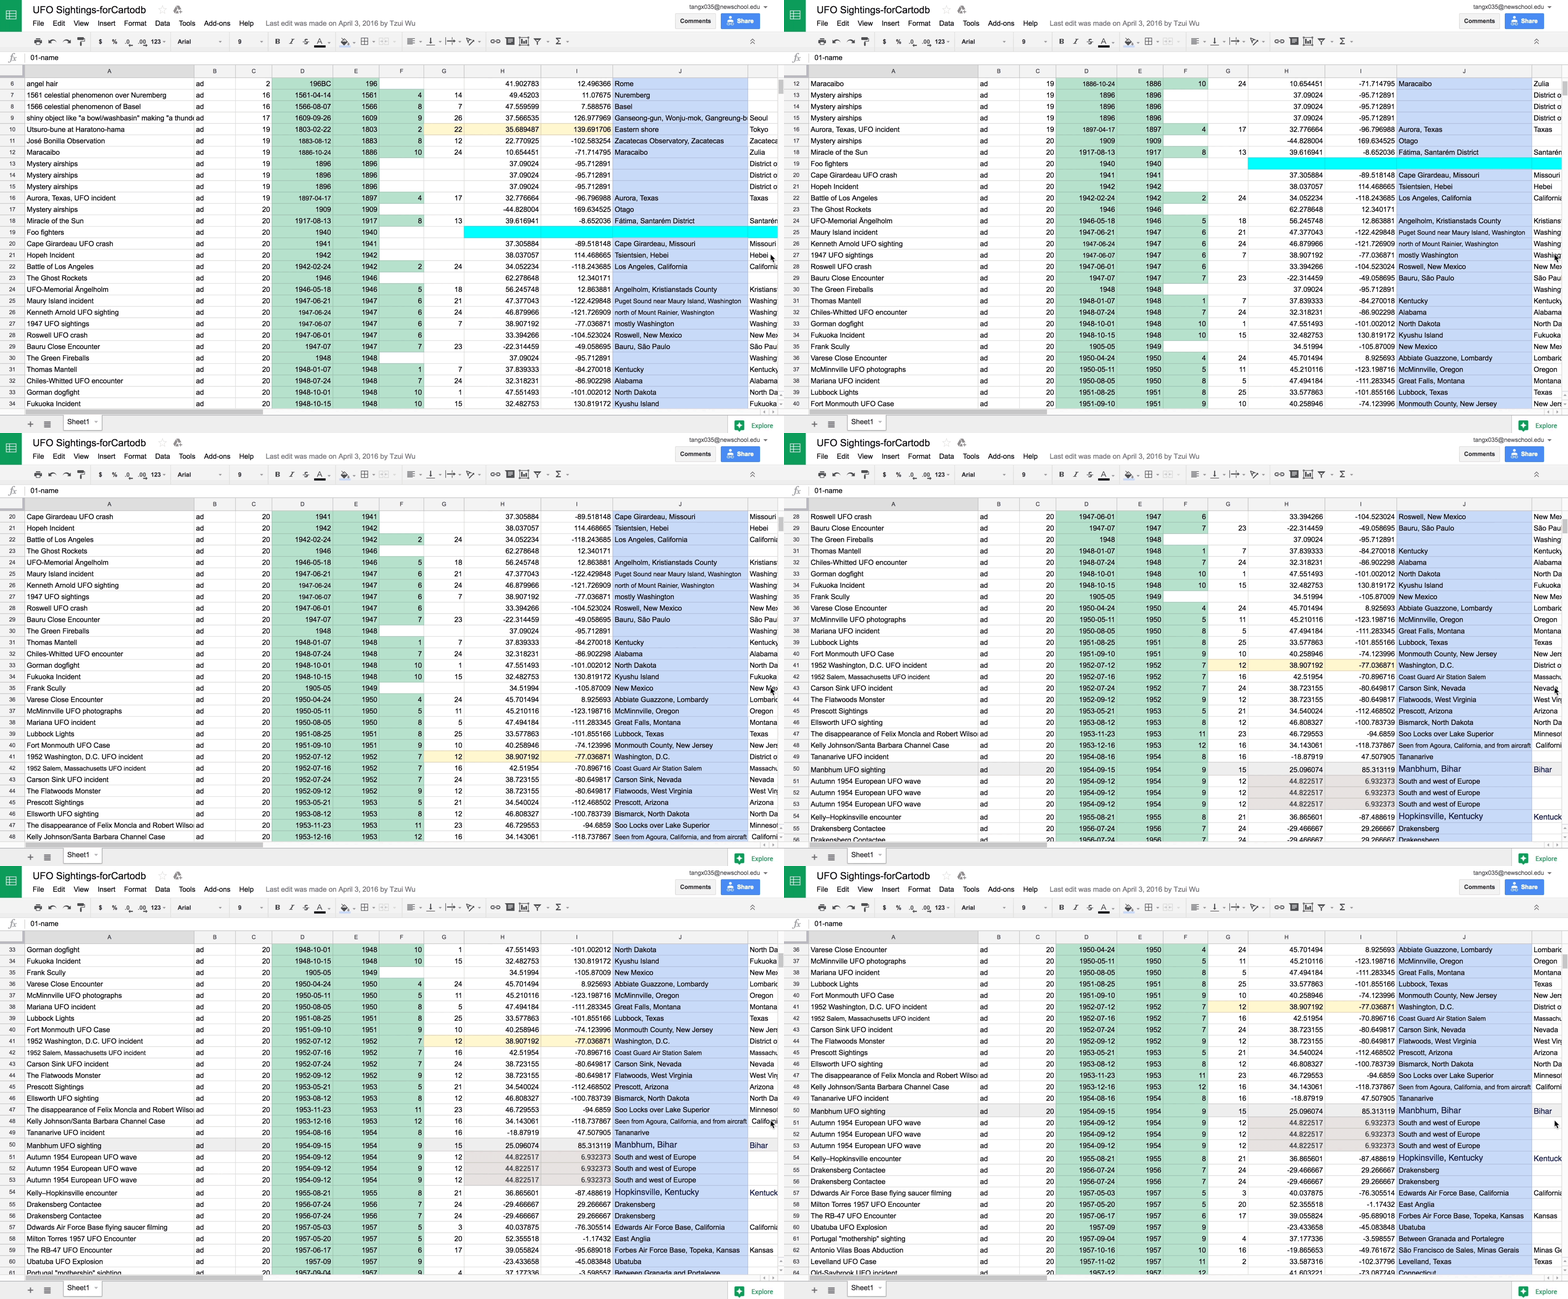
The data was retrieved from the "the list of UFO sightings" Wikipedia. We reorganized the list in the Google stylesheet, and input to CartoDB to present the world map.

The data can be seen and interacted on the final data visualization map includes:
The Date - from 214 BCE. to 2011 February 20th.
The Location - countries across centuries, which are shifting names
The Hynek Scale - the levels of human in touch with UFOs
The Event Description - brief stories
